|
|
Analysis of the Tsunami Travel Time maps
for damaging tsunamis in the World Ocean
Of all 2250 tsunamigenic events historically known, only 223 (about 10%) resulted in human fatalities. Geographical distribution of these events is shown in Fig.4. Less than a quarter of all the events had the number of fatalities exceeding 1000, and only in 132 cases the death tall exceeded 10,000. In all but 11 events, listed in Table 1, the resulted damage and all fatalities were limited to a nearby area within one hour propagation time. Those 11 events are the so called trans-oceanic tsunamis and they were able to transfer their energy well outside the area of origin. However, a detailed analysis given in Section 4 shows that even in trans-oceanic tsunamis a major damage and over 90% of all fatalities occur in the nearby area within one hour propagation time.

Geographical distribution of 223 tsunamigenic events in the World Ocean that resulted in human fatalities. The size of circles is proportional to the earthquake magnitude. Sources that generated the trans-oceanic tsunamis are shown in red.
Table 1. The list of historically known trans-oceanic tsunamis occurred in the World Ocean during the last 250 years.
| Date and place | Magnitude | Max run-up
near the
source, m | Max run-up
in the far-
field, m | Fatalities |
| November 1, 1755 Lisbon | 8.5 | 18 | 7.0 | 40000 |
| November 7, 1837 Chile | 8.5 | 8 | 6.0 | many |
| August 13, 1868 Chile | 9.1 | 18 | 10 | 3000 |
| August 27, 1883 Krakatau |
| 36 | 1.5 | 36000 |
| February 3, 1923 Kamchatka | 8.3 | 8 | 6.1 | some |
| April 1, 1946 Aleutians | 7.4 | 42 | 18 | 165 |
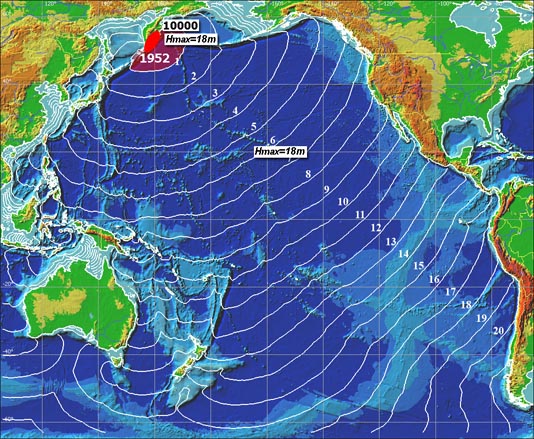
| November 4, 1952 Kamchatka | 9.0 | 18 | 9.1 | >10000 |
| March 9, 1957 Aleutians | 9.1 | 15 | 10 | none |
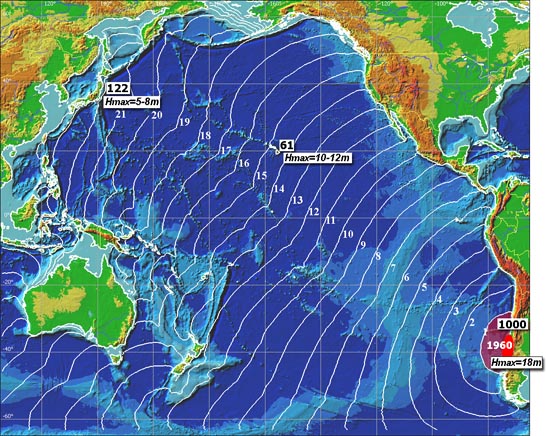
| May 22, 1960 Chile | 9.5 | 18 | 12 | 1180 |
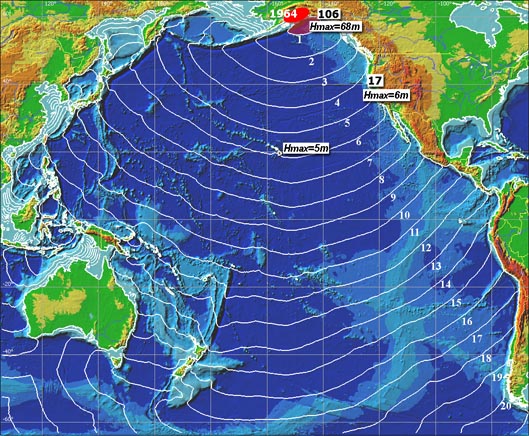
| March 28, 1964, Alaska | 9.2 | 68 | 6.0 | 123 |
| December 26, 2005 Sumatra | 9.3 | 34 | 9.1 | 280000 |
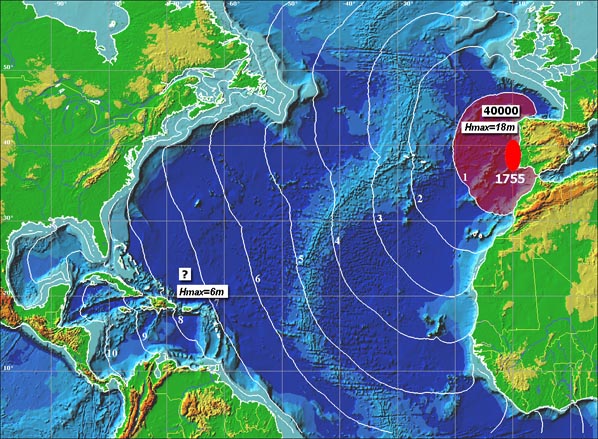
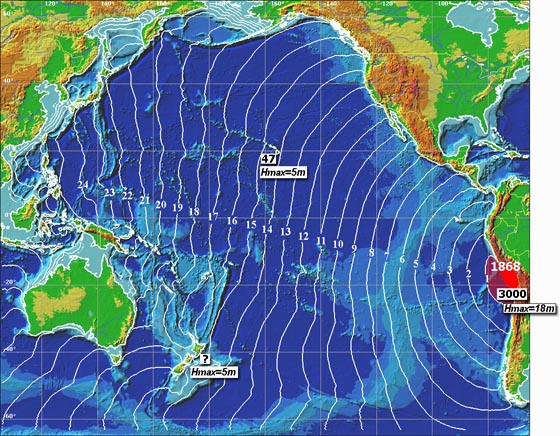
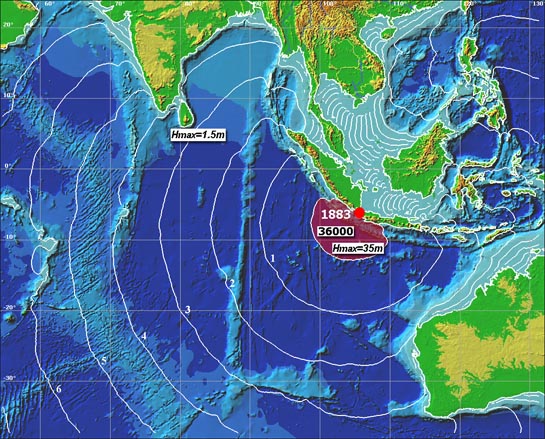
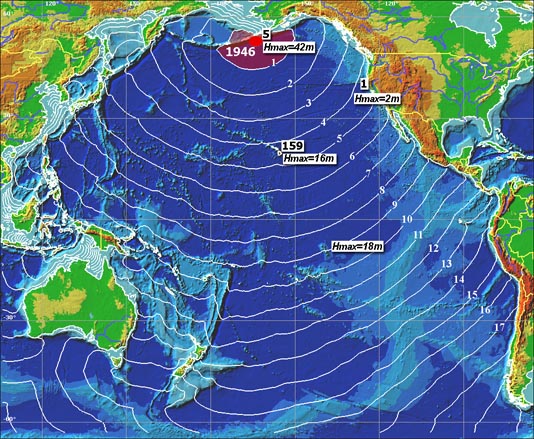
Trans-oceanic tsunamis
Trans-oceanic tsunamis, capable to transmit their energy far away of the source area, are quite rare events as compared to local and regional events, however, they are responsible for a considerable part of damage and fatalities resulted from all tsunamis. In this section, we give a brief description and calculate the TTT maps for the trans-oceanic tsunamis occurred in the World Ocean during the last 300 years
Regional tsunamis
All historically known tsunamis sources are located within the continental slope or the shelf at the average distance of 150-200 km of the coastline. A typical example of geographical distribution of tsunami sources can be seen in Fig.13 that shows position of tsunamigenic sources for 78 historical tsunamigenic events near Japan resulted in human fatalities. In this figure, red and green dotted lines show the limits of 20-min and 40-min tsunami propagation time areas, respectively. One can see that about 40% of all deadly tsunamis occur within 20 min of propagation time to the nearest coast, and ALL of them fall within 40-min time limit.
As an example of the TTT calculation for a regional tsunami, in Fig.14 a TTT chart for the June 15, 1896 Sanriku tsunami is shown. This was one of the largest tsunami whenever occurred in Japan. The maximum run-up height at the nearest coast reached 38.3 m. These destructive waves killed 27,122 people and 9247 were injured, 10617 houses were washed away. Despite the tsunami was observed all along the eastern coast of Japan as well as in Hawaii and the US West Coast, the main impact fell within just 200-km part of the eastern coast of the Iwate and Miyako Prefectures where all of 27122 fatalities occurred. From the TTT map in Fig.12 one can see that this part of the coast is located within just 40-min travel time zone. On this coast, a tsunami began after 20 min of a seismic shock. The largest was the second wave that caused most of the damage and almost all fatalities.
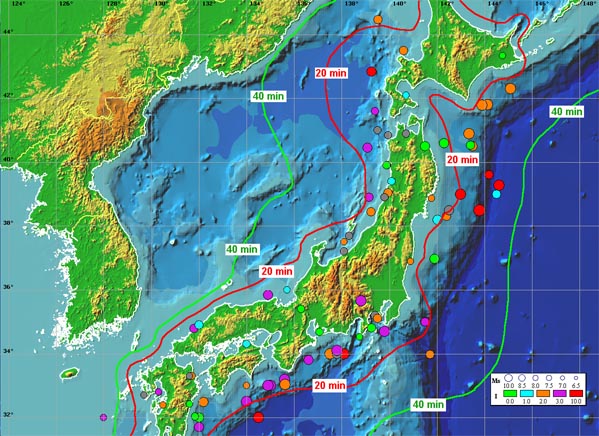
A map of sources of 78 deadly tsunamis that occurred from 684 to 2003 around Japan. Red and green dotted lines show the limits of 20-min and 40-min tsunami propagation time areas, respectively.
.jpg)
A tsunami travel time chart for the 1896 Sanriku tsunami that resulted in 27,122 fatalities in the Sanriku coast of Japan (north-eastern Honshu). Solid ellipse marks the estimated position of the tsunami source, red color shows the area within 10-min travel time. Digits near the isochrones - travel time (in minutes).
One of the most devastating recent tsunami was generated by a large Ms7.6 earthquake in the Moro Gulf in the Philippines on 16 August 1976 (Fig.15). A large tsunami with run-up height up to 5-6 meter generated by the earthquake resulted in the death of thousands of people in coastal communities in the Sulu Islands, North and South Zamboanga, North and South Lanao, North Cotabato, Maguindanao, and Sultan Kudarat, on the island of Mindanao (Pararas-Caraynnis , 1976).. Available estimates of the death toll for this tsunami vary from 3,700 (PHIVOLCS Web-page, 2006) to over 10,000 (Pararas-Caraynnis Tsunami Web-page, 2006) people. (This particular example shows how uncertain can be the data on fatalities even for the recent tsunamis.) Since the source of this earthquake was located very close to the heavily populated coast most of these people died during the first 30 min after the quake.
.jpg)
A tsunami travel time chart for the 1976 Mindanao tsunami that resulted in over 4,000 fatalities in the nearby coast of the Moro Gulf, Philippines. Solid ellipse marks the estimated position of the tsunami source, red color shows the area within 10-min travel time. Digits near the isochrones - tsunami travel time (in minutes).
In South America, due to seismotectonic features of the region, the sources of ALL tsunamigenic events are located within the area with 20-min propagation time limit. For many South America tsunamis, their sources were located partly in-land, so the first wave arrived almost simultaneously or shortly after the end of seismic shaking caused by the fault rupture.
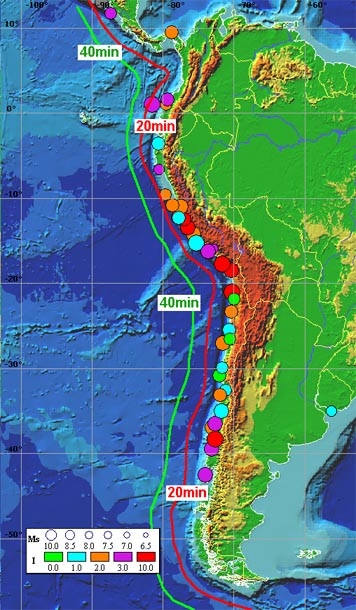
A map of sources of 38 deadly tsunamis that occurred from 1575 to 2001 near South America coast. Red and green dotted lines show the limits of 20-min and 40-min tsunami propagation time areas, respectively.
In the Indian ocean region, the majority (95%) of all tsunamigenic events occur within a narrow strip between the axis of the Sumatra-Java deep-water trench and south-western coast of the Sumatra and Java islands. Fig.17 shows the limits of 20-min and 40-min propagation time zones near the coast of Sumatra. Out of 46 historical tsunamis generated in this area from 1722 to 2005, 26 (61%) occurred within 20-min propagation time zone. Only for 4 (10%) events, the travel time of the leading wave exceeded 40 minutes, and for all tsunamigenic events in this area the minimum propagation time was within one hour.
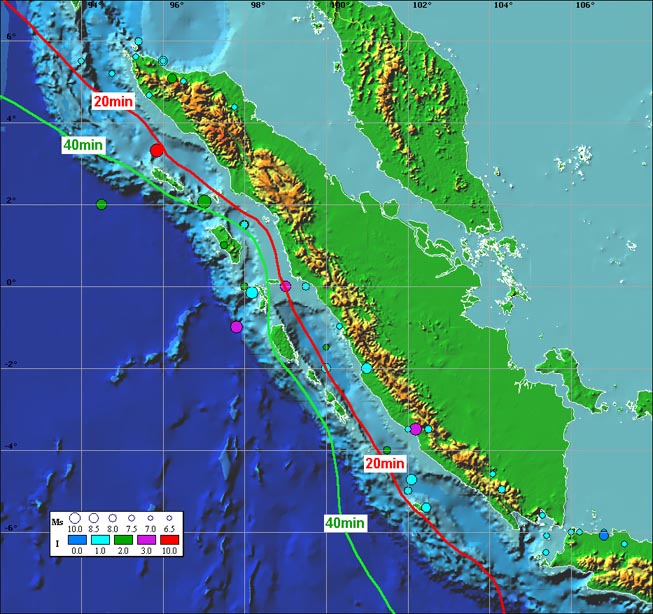
A map of sources of 46 historical tsunamis that occurred from 1722 to 2005 near the west coast of Sumatra, Indonesia. Red and green dotted lines show the limits of 20-min and 40-min tsunami propagation time areas, respectively.
Discussion
The current version of the GTDB contains nearly 2250 historical tsunamigenic events covering the period from 1628 BC to present. To the best of our present-day knowledge, only 223 (10%) of these events resulted in any fatalities, all others were weak local events observable only in several particular areas of the nearest coast. In total, the 223 deadly events are responsible for 694,000 lives lost due to tsunamis at the coast of the World Ocean during all the historical period of available observations.
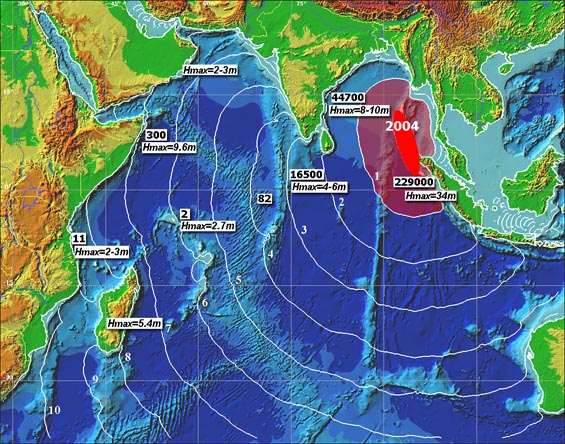
Out of 223 deadly historical tsunamis, only 11 fall into a category of the so-called trans-oceanic events capable to produce a considerable damage and human fatalities well outside their area of origin. In total, these 11 trans-oceanic tsunamis are responsible for 371,670 (53%) of all fatalities. Among them, 280,000 people were killed during just one event - the December 26, 2004 Indian Ocean tsunami. Other 10 trans-oceanic tsunamis are responsible for 92,000 deaths that is only 13% of all tsunami-related fatalities
The rest of 212 events (95% of all deadly historically known tsunamis) are the local or regional events whose main damage and all fatalities are limited to a nearby area within one hour propagation time. In total, they are responsible for 322,000 (47%) fatalities. The present level of accuracy and completeness of the data available in the Global Tsunami Database does not allow studying a more detailed distribution of tsunami fatalities over the propagation time within this one-hour TTT zone (say, over 10-min intervals), but roughly we can say that out of these 212 local and regional deadly tsunamis, 60% had their sources within 30-min propagation time limit. This conclusion is based on counting the number of tsunamigenic sources located within 30-min TTT zone in several most active tsunamigenic regions like Japan, South America, Indonesia, Philippines, Kuril-Kamchatka and Aleutians.
The available data on fatalities from 11 trans-oceanic tsunamis allows one to carry out a more detailed study on their distribution over propagation time. Fig.18 shows a histogram of a number of fatalities over one-hour time intervals for 11 trans-oceanic tsunamis, listed in Table 1. It clearly shows that although a damaging impact of large trans-oceanic tsunamis can last up to 23-24 hours, over 80% of all their fatalities occur within the first hour of propagation time. Another 12% of fatalities happen within the second hour of TTT, and the rest 4% occur during the remaining time (exceeding two hours).
A histogram of a number of fatalities depending on travel time (in hours) for 11 trans-oceanic tsunamis listed in Table 1. The digits above columns show the accumulated number of fatalities occurred within a particular interval of tsunami travel time.
Conclusions
- The current version of the Global Historical Tsunami DataBase (GTDB) covers the period from 1628 B.C. till present and contains nearly 2250 historical events with 1206 of them occurred in the Pacific, 263 in the Atlantic, 125 in the Indian ocean and 545 in the Mediterranean region. In total, these events are responsible for 694,000 lives lost in tsunami waves during all the historical period of available observations.
- Out of the total 2250 events, only 223 tsunamis resulted in any fatalities, all others were weak local events observable only in several particular areas of the nearest coast. From these 223 deadly tsunamis, 212 (95%) fall into the category of local and regional events with most of damage and all fatalities limited to one-hour propagation time. In total, they are responsible for 322,000 (47%) fatalities.
- The 11 trans-oceanic tsunamis that occurred in the World Ocean during the last 250 years are responsible for 372,000 (53%) fatalities. Among them, 280,000 people were killed during just one event - the December 26, 2004 Indian Ocean tsunami. Other 10 trans-oceanic tsunamis are responsible for 92,000 deaths that is only 13% of all tsunami-related fatalities.
- The detailed study of the death toll for 11 most destructive trans-oceanic tsunamis occurred in the World Ocean during the last 250 years shows that although the damaging impact of large tsunamis can last up to 23-24 hours, over 84% of their fatalities occuring within the first hour propagation time. Another 12% fatalities occur within the second hour, with the rest of 4% occurring at the remaining time (exceeding two hours).
- The overwhelming majority of other tsunamis (99.5% of all historical cases and 95% of all damaging events) are local and regional events whose major damage and all fatalities are limited to a near-source area within one hour travel time. Among these events, more than a half (60%) had their sources within 30-min propagation time limit.
- The above conclusions, obtained in the present study by the analysis of the most complete historical dataset available in digital domain, are important facts and should be taken into account in design and implementation of any regional or basin-wide tsunami warning system.
|