|
|
Integrated Tsunami Database for the World Ocean
( WinITDB/WLD )
A comprehensive Integrated Tsunami DataBase (ITDB) for the World Ocean has been
compiled as part of the joint IUGG/TC and ICG/ITSU Project "Basic Pacific
Tsunami Catalog and Database". The project, launched in 1997, is directed to
improve the situation with catalogization of historical tsunamis in the Pacific
by means of organizing them in the form of the parametric tsunami catalog and
the database. Its final goal is the development of the comprehensive historical
tsunami catalog covering the whole historical period and containing all the
meaningful tsunami data along with additional reference information related to
the tsunami problem in the Pacific. The database consists of three main parts:
the catalog of tsunamigenic events with their basic source parameters, the
catalog of the observed run-up heights and a Pacific-wide catalog of historical
earthquakes from pre-historic times till present. The current version of the
database covers the period from 47 B.C. to present
time and contains 2022 entries in the tsunamigenic event catalog, over 10180
run-up heights provided with the exact geographical coordinates of the
observational sites, and the parametric source data on nearly 230,000 historical
earthquakes. A set of collected parameters of tsunamigenic events includes date,
time, coordinates of the epicenter, source depth, surface-wave and
moment-magnitudes, Abe's tsunami magnitude, tsunami intensity (on the
Soloviev-Imamura scale), the maximum tsunami run-up height, the number of
available run-up observations, a cause of the tsunami, validity of the event,
coded name of the source region and the main reference to the event.
The tsunami and earthquake catalogs, collected within the ITDB Project, are
embedded inside a specially developed GIS-type graphic shell (WinITDB) for
easy data retrieval, visualization and processing. The WinITDB shell operates
on Windows PC platforms with no additional co-located software required. The
full version of the database, provided with the Windows-based graphic shell,
is distributed on a CD-ROM that includes also the textual descriptions of
tsunami manifestation (currently available for 245 events) and some additional
reference information related to the tsunami problem (list of 993 active
volcanoes, list of 755 mareograph stations, list of more than 25000 coastal
populated places in the Pacific), is distributed on the CD-ROM.
The basic functions of the system are as follows:
- selection of a working area on the world-wide and regional maps and zooming to the full screen size;
- construction of a raster (3D shaded relief) and/or vector (land contours, main rivers and lakes, state borders) background map of the selected area;
- search and retrieval of historical seismic and tsunami data by a number of criteria and their display in the variety of options on the constructed background map;
- calculation of Tsunami Travel Time (TTT) charts and their display over the background map;
- calculation of the tsunami wave forms for a realistic model of a seismic source for any selected area provided with digital bathymetric data.
Some examples of work of the WinITDB program:
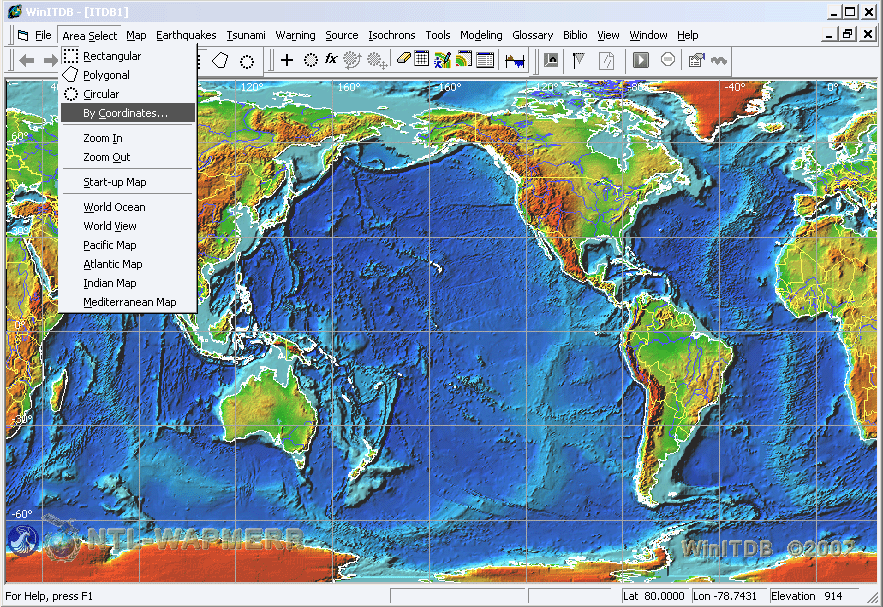
The main screen of the WinITDB graphic shell. The "Area Select" sub-menu is open and shows the list of available options. Current cursor coordinates and depth/elevation readings are displayed at the bottom of the screen
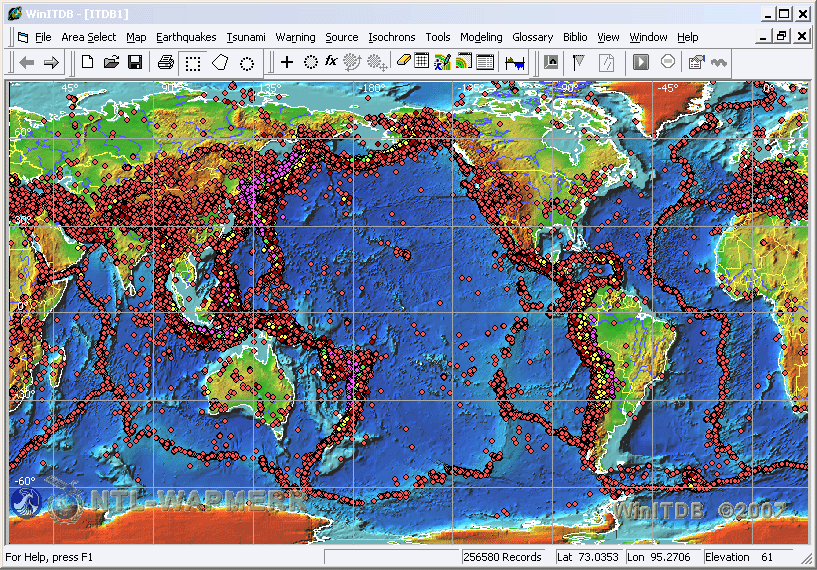 Map of historical earthquake epicenters from 1500BC to present time
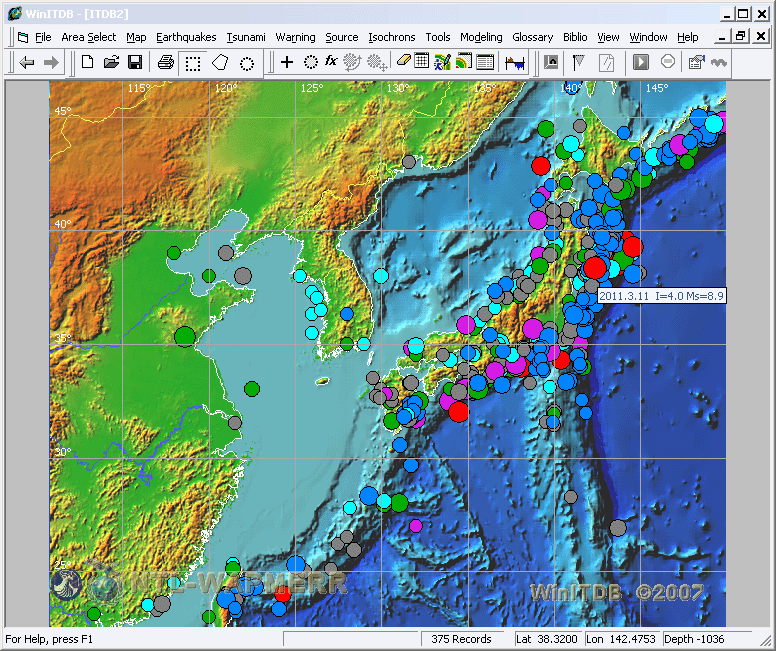
The map of historical tsunamigenic events in the Japan region for the past 1500 years
|
|
|
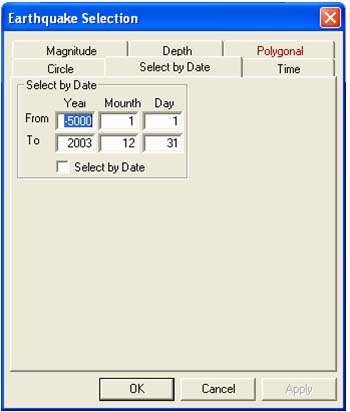
The "Earthquake Selection" pop-up window. Seismic data can be selected by date, time, source depth, magnitude and coordinates.
|
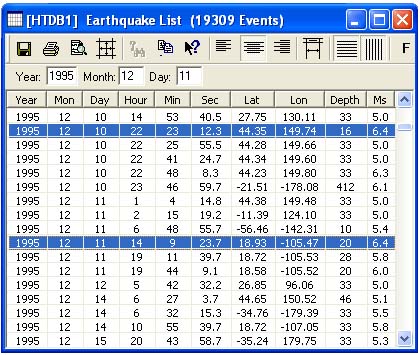
The "Earthquake List" pop-up window. Contains detailed data about every selected event
|
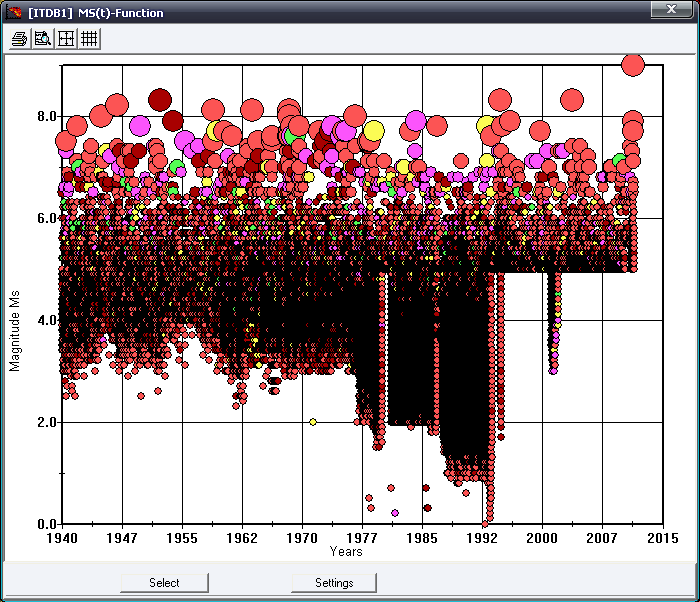
An example of the Ms(t) diagram. (Japan region)
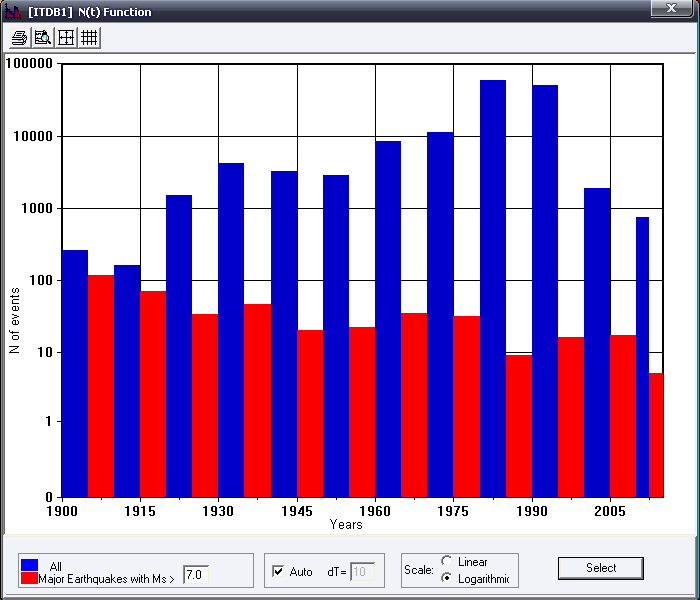
An example of the N(t) diagram. (Japan region)
|
|
|
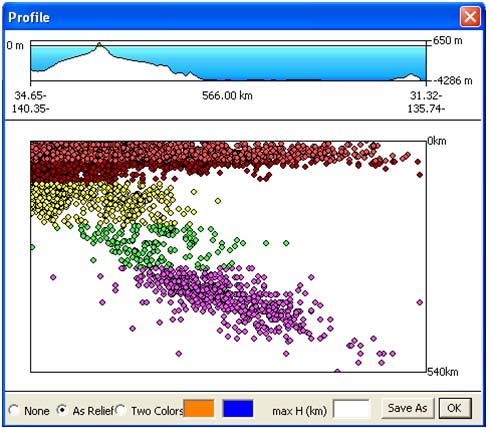
An example of the vertical cross-section of the seismicity map
|
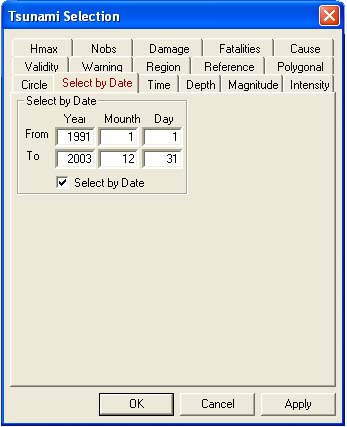
The "Tsunami Selection" pop-up window
|
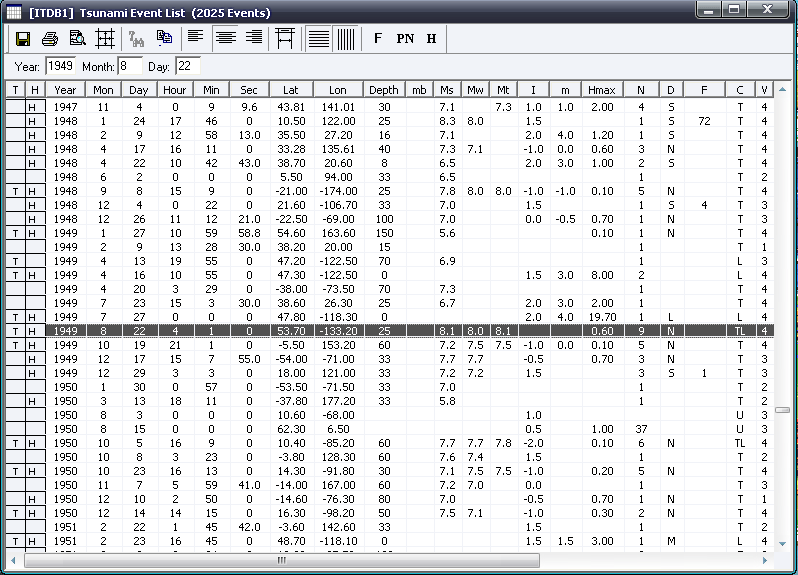
The "Tsunami Events List" pop-up window. Contains over 30 different data parameters for every event.
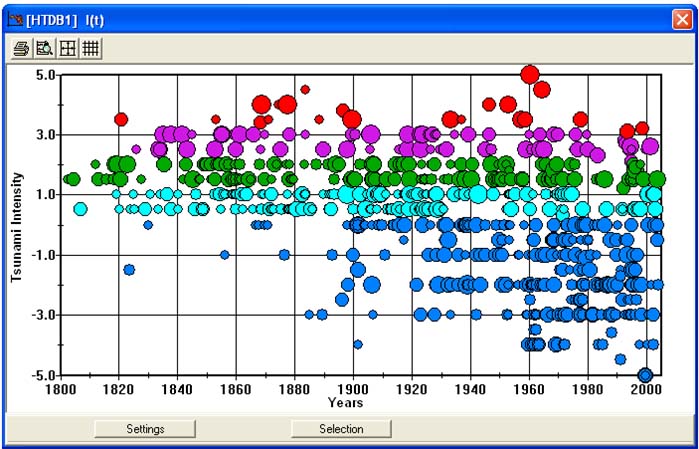
An example of the I(t) diagram
|
|
|
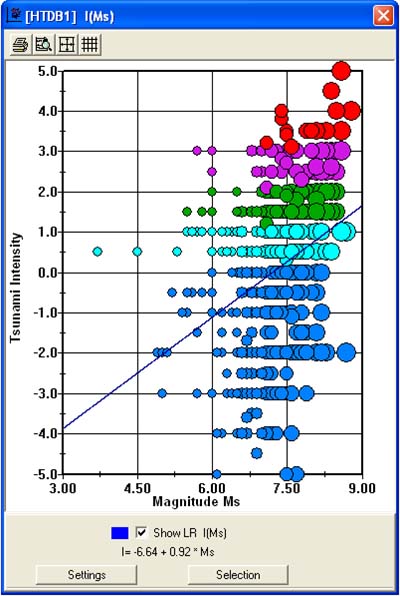
An example of the I(Ms) diagram
|
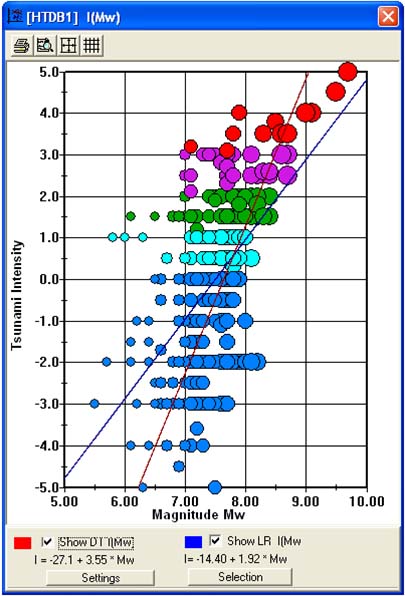
An example of the I(Mw) diagram
|
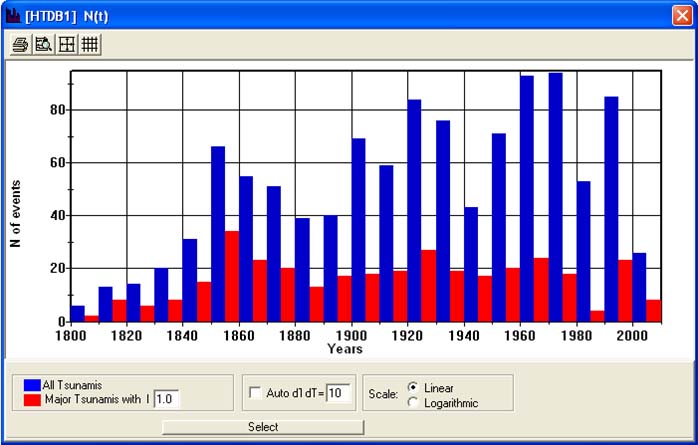
An example of the N(t) histogram
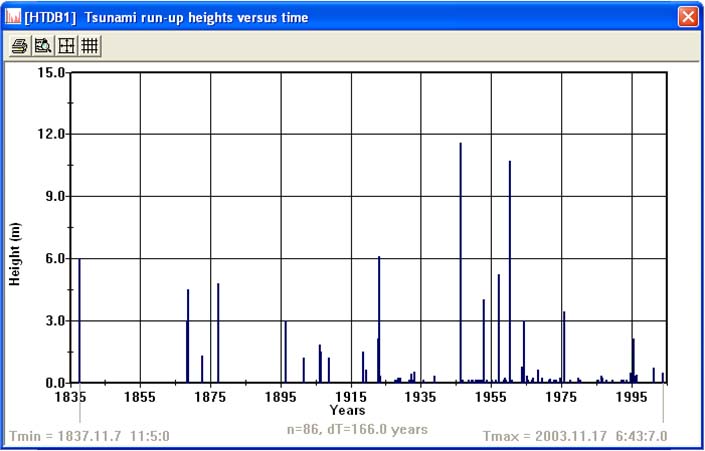
The "Tsunami run-up heights versus time" pop-up window (example for Hilo, Hawaii)
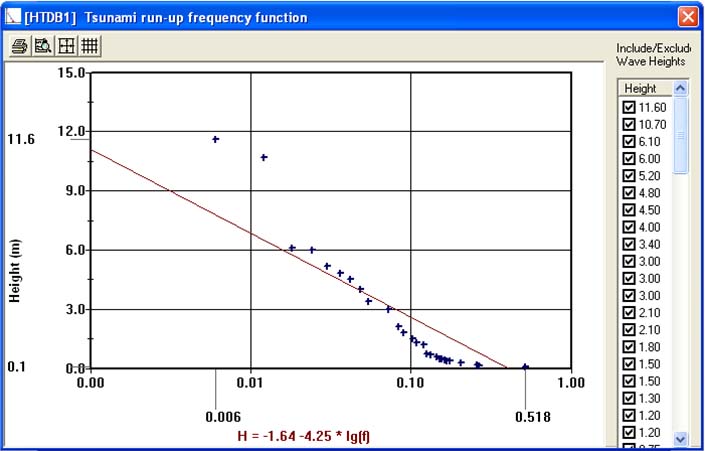
The "Tsunami run-up frequency function" pop-up window
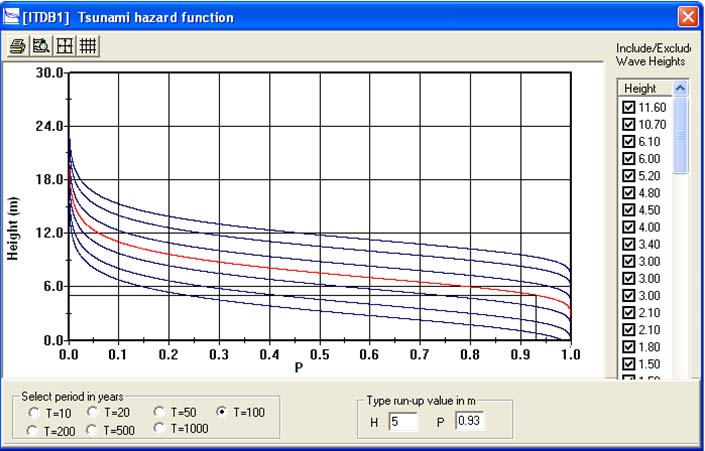
The "Tsunami hazard function" pop-up window
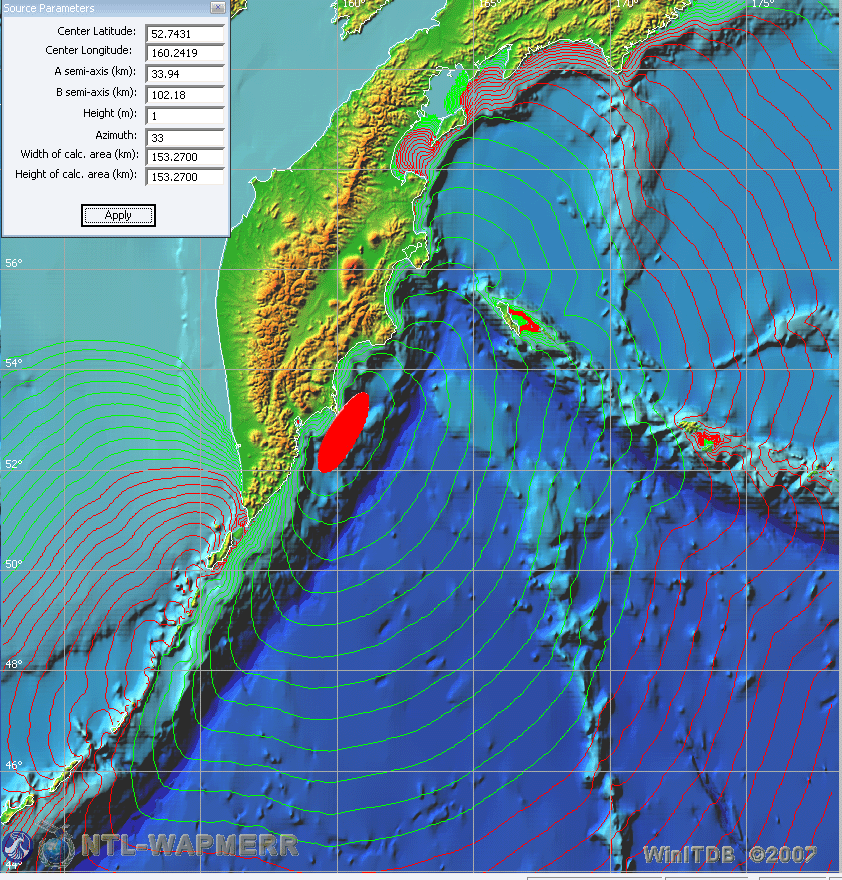
The Tsunami Travel Time map calculated for an elliptic source located near the east coast of Kamchatka.
|
