|
|
Data
|
 |
|
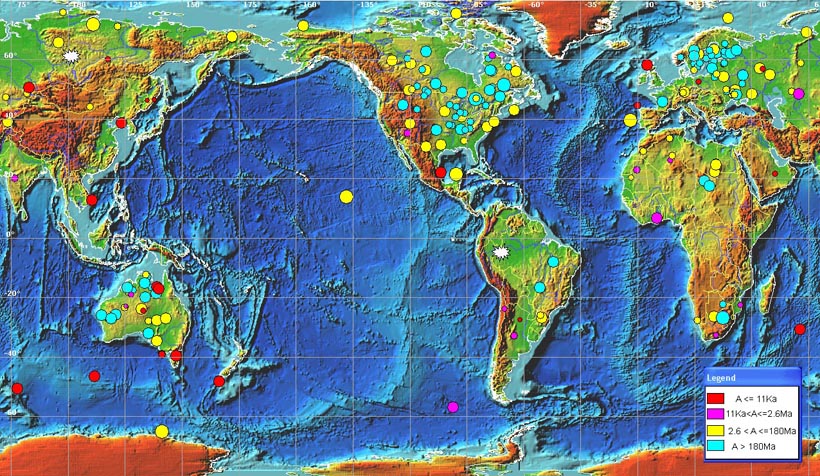
Map of confirmed impact structures on the Earth surface (180 structures) and on the oceanic bottom (24 structures). Size of circles is proportional to the crater diameter. Color shows the age of formation divided into four groups. White stars depict the epicenters of two largest air blasts of the XX century - Tunguska (1908) and Brasil (1930). Density of land impacts basically reflects the quality of geological mapping of the territory rather than actual spatial distribution of the impact structures. It should be noted that 16 of 24 known oceanic craters were discovered during just two years (2005-2006) after beginning of systematic search of submarine impact structures.
Source - Expert Database on the Earth Impact Structures (EDEIS), Tsunami Laboratory, ICMMG SD RAS, Novosibirsk, 2006
|
 |
|
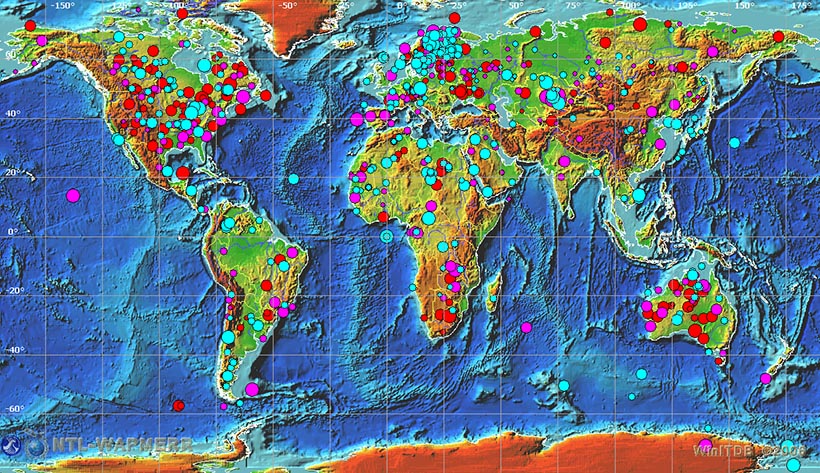
Map of confirmed (red), perspective for verification (magenta) and proposed for further study (blue) impact structures on the Earth. Size of circles is proportional to the crater diameter. Altogether almost 800 structures are shown.
Source - Expert Database on the Earth Impact Structures (EDEIS), Tsunami Laboratory, ICMMG SD RAS, Novosibirsk, 2006
|
 |
|
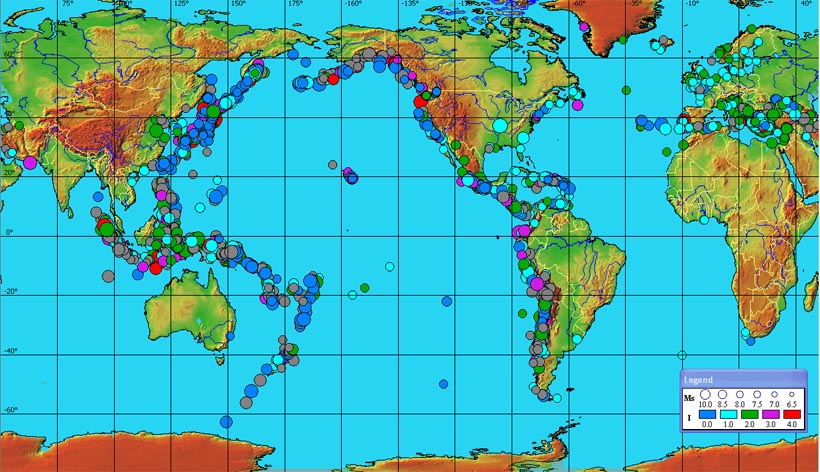
Visualization of the full global historical tsunami catalog. 1965 tsunamigenic sources are shown for the period from 1628 BC (Santorini eruption) to present time. Size is circles is proportional to the event magnitude (for tectonic tsunamis), color represent the tsunami intensity on the Soloviev-Imamura scale.
Source - Global Tsunami Database (GTDB), Tsunami Laboratory, ICMMG SD RAS, Novosibirsk, 2006
|
 |
|
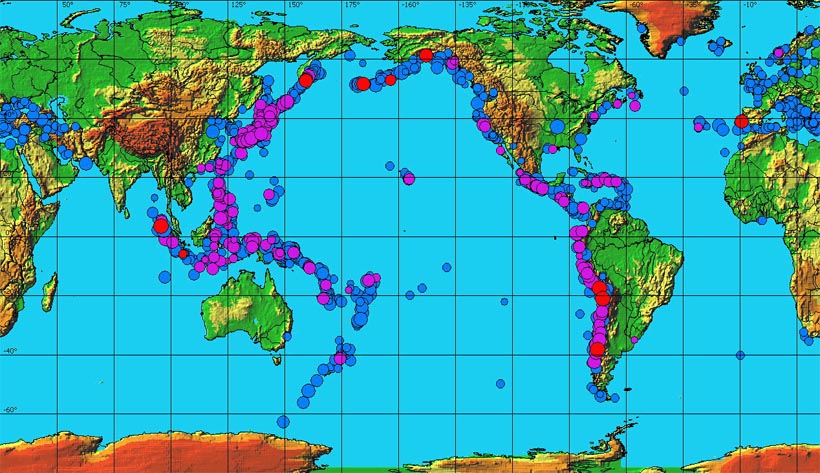
Map of historical tsunami sources in the World Ocean (1965 events for the period from 1628BC to present). The size of circle is proportional to the source magnitude (for seismically induced tsunamis), color represents the type of event: red - transoceanic tsunamis (11), magenta - regional tsunamis resulted in fatalities (223), blue - all other tsunamis (1731).
Source - Global Tsunami Database (GTDB), Tsunami Laboratory, ICMMG SD RAS, Novosibirsk, 2006
|
|
